Manual
PySNAIL provides an application programming interface (API) in Python for developers or bioinformaticians who wants to control more parameters used in the analysis.
Correct Expression
import os
from pysnail import Dataset, qsmooth

xprs = os.path.realpath('sample_data/expression.tsv')
groups = os.path.realpath('sample_data/groups.tsv')
dataset = Dataset(xprs, groups, **{'index_col': 0, 'sep': '\t'})

xprs_norm, qstat = qsmooth(dataset, aggregation='auto', threshold=0.2, cutoff=0.15)
xprs_norm.to_csv(os.path.realpath('pysnail_out.tsv'), sep='\t')
Information of Input Data
print(dataset)
Statistics of Qsmooth
Get number of affected genes for each samples.
qstat.num_affected_genes
Result:
Group                        Sample
Embryonic Facial Prominence  ENCFF132NQU       0
                             ENCFF262TXH       0
                             ENCFF369TLJ       0
                             ENCFF370UDF       0
                             ENCFF536XKZ       0
                                             ...
Stomach                      ENCFF052DOQ       0
                             ENCFF288JNN       0
                             ENCFF355MOU       0
                             ENCFF691EQW       0
                             ENCFF972NMO    2730
Length: 126, dtype: int64
Get number of affected samples in the dataset.
qstat.num_affected_samples
Result:
1
Get affected genes for each sample.
print(qstat.num_affected_samples)
Result:
Group              Embryonic Facial Prominence                          \
Sample                             ENCFF132NQU ENCFF262TXH ENCFF369TLJ
ENSMUSG00000082905                       False       False       False
ENSMUSG00000026174                       False       False       False
ENSMUSG00000031293                       False       False       False
ENSMUSG00000062458                       False       False       False
ENSMUSG00000083793                       False       False       False
...                                        ...         ...         ...
ENSMUSG00000015093                       False       False       False
ENSMUSG00000098607                       False       False       False
ENSMUSG00000102632                       False       False       False
ENSMUSG00000093969                       False       False       False
ENSMUSG00000050876                       False       False       False

Group                                                               \
Sample             ENCFF370UDF ENCFF536XKZ ENCFF594CEM ENCFF672DDJ
ENSMUSG00000082905       False       False       False       False
ENSMUSG00000026174       False       False       False       False
ENSMUSG00000031293       False       False       False       False
ENSMUSG00000062458       False       False       False       False
ENSMUSG00000083793       False       False       False       False
...                        ...         ...         ...         ...
ENSMUSG00000015093       False       False       False       False
ENSMUSG00000098607       False       False       False       False
ENSMUSG00000102632       False       False       False       False
ENSMUSG00000102632       False       False       False       False
ENSMUSG00000093969       False       False       False       False
ENSMUSG00000050876       False       False       False       False
Diagnosis of Qsmooth
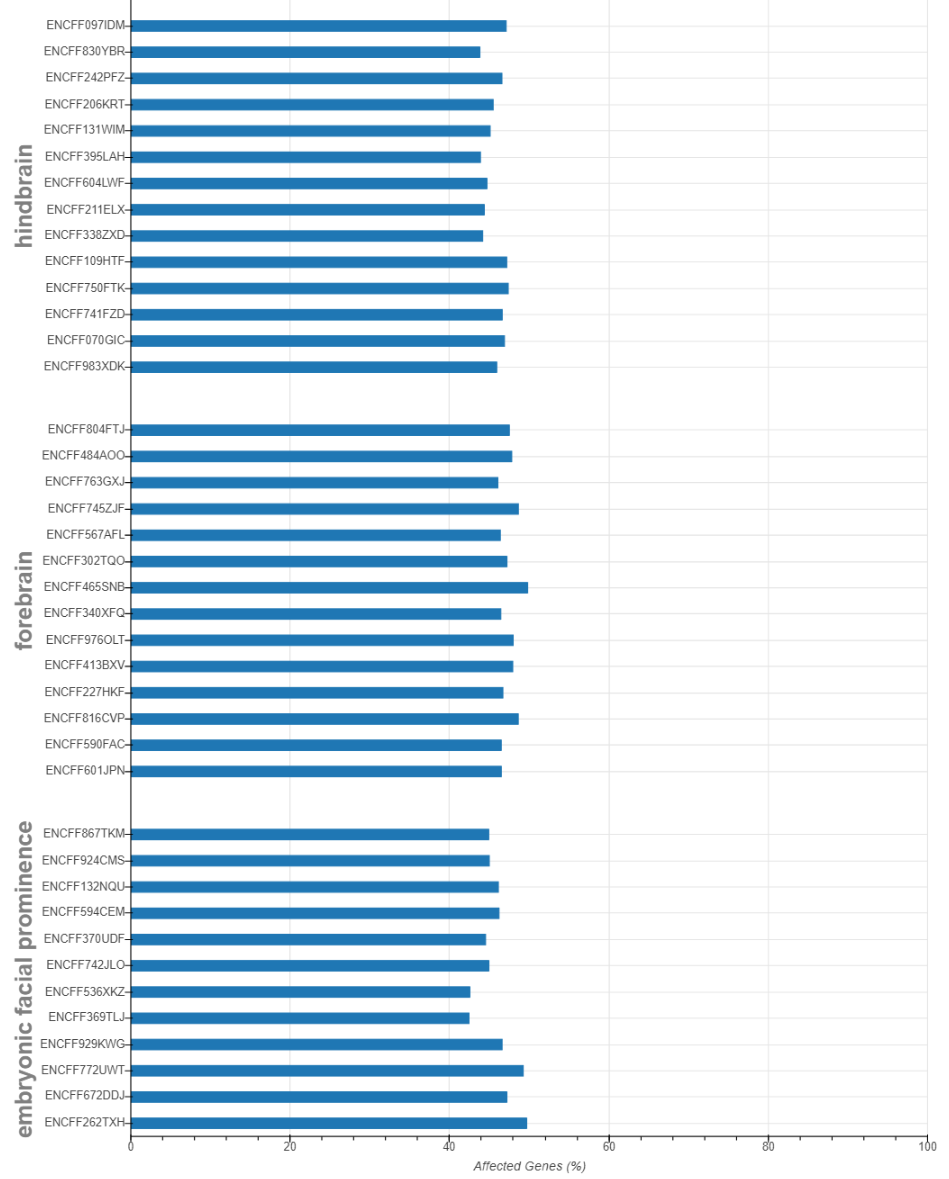
Make bar plot on number of affected genes for each sample
from pysnail import bokeh_affected_barplot
bokeh_affected_barplot(dataset, qstat, 'output')
Result (the result shown here is excerpted from the analysis in the manuscript instead of from the sample data. ):